
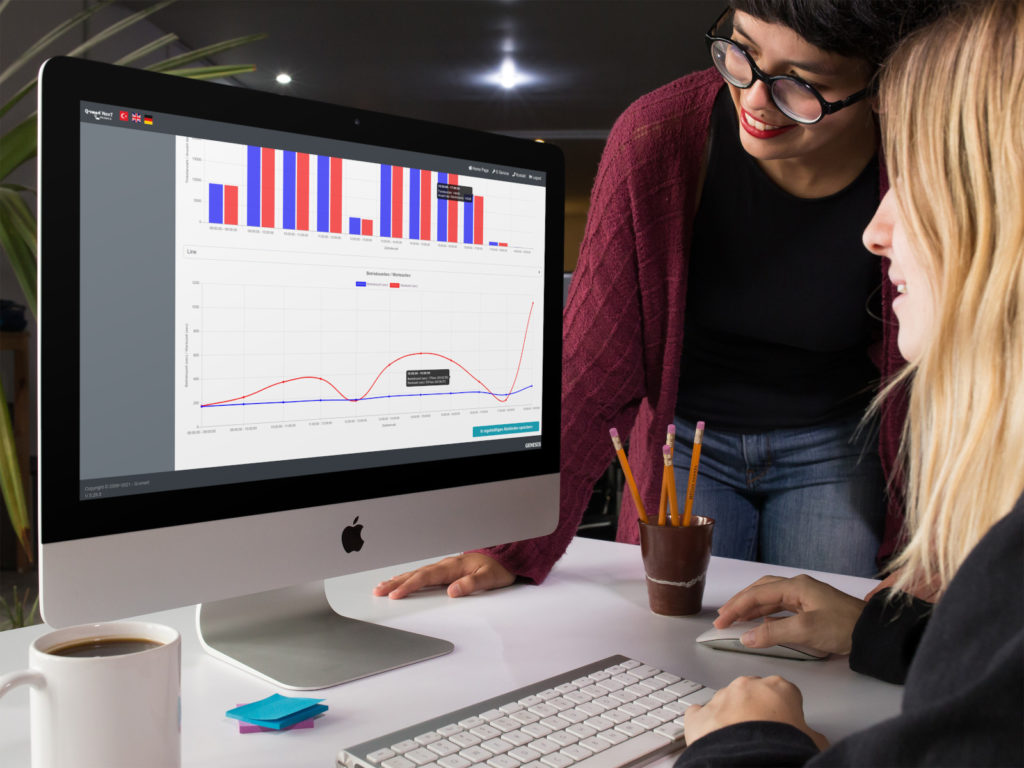
Detailed performance reports
Q-smart queue management system provides detailed performance reports in all type of the systems managed through a single or central management structure. In central managed systems, you can obtain all-branches reports as well as singular branch office-based performance reports.
Get detailed information about;
– The rush hours of your organization by viewing the hourly work report
– The detailed daily work intensity by viewing daily work report issued for each day of the week,
– The monthly work performance by viewing the monthly work report
– You can obtain your yearly service, branch office or employee performances report by viewing the yearly work report
– Live system and service status
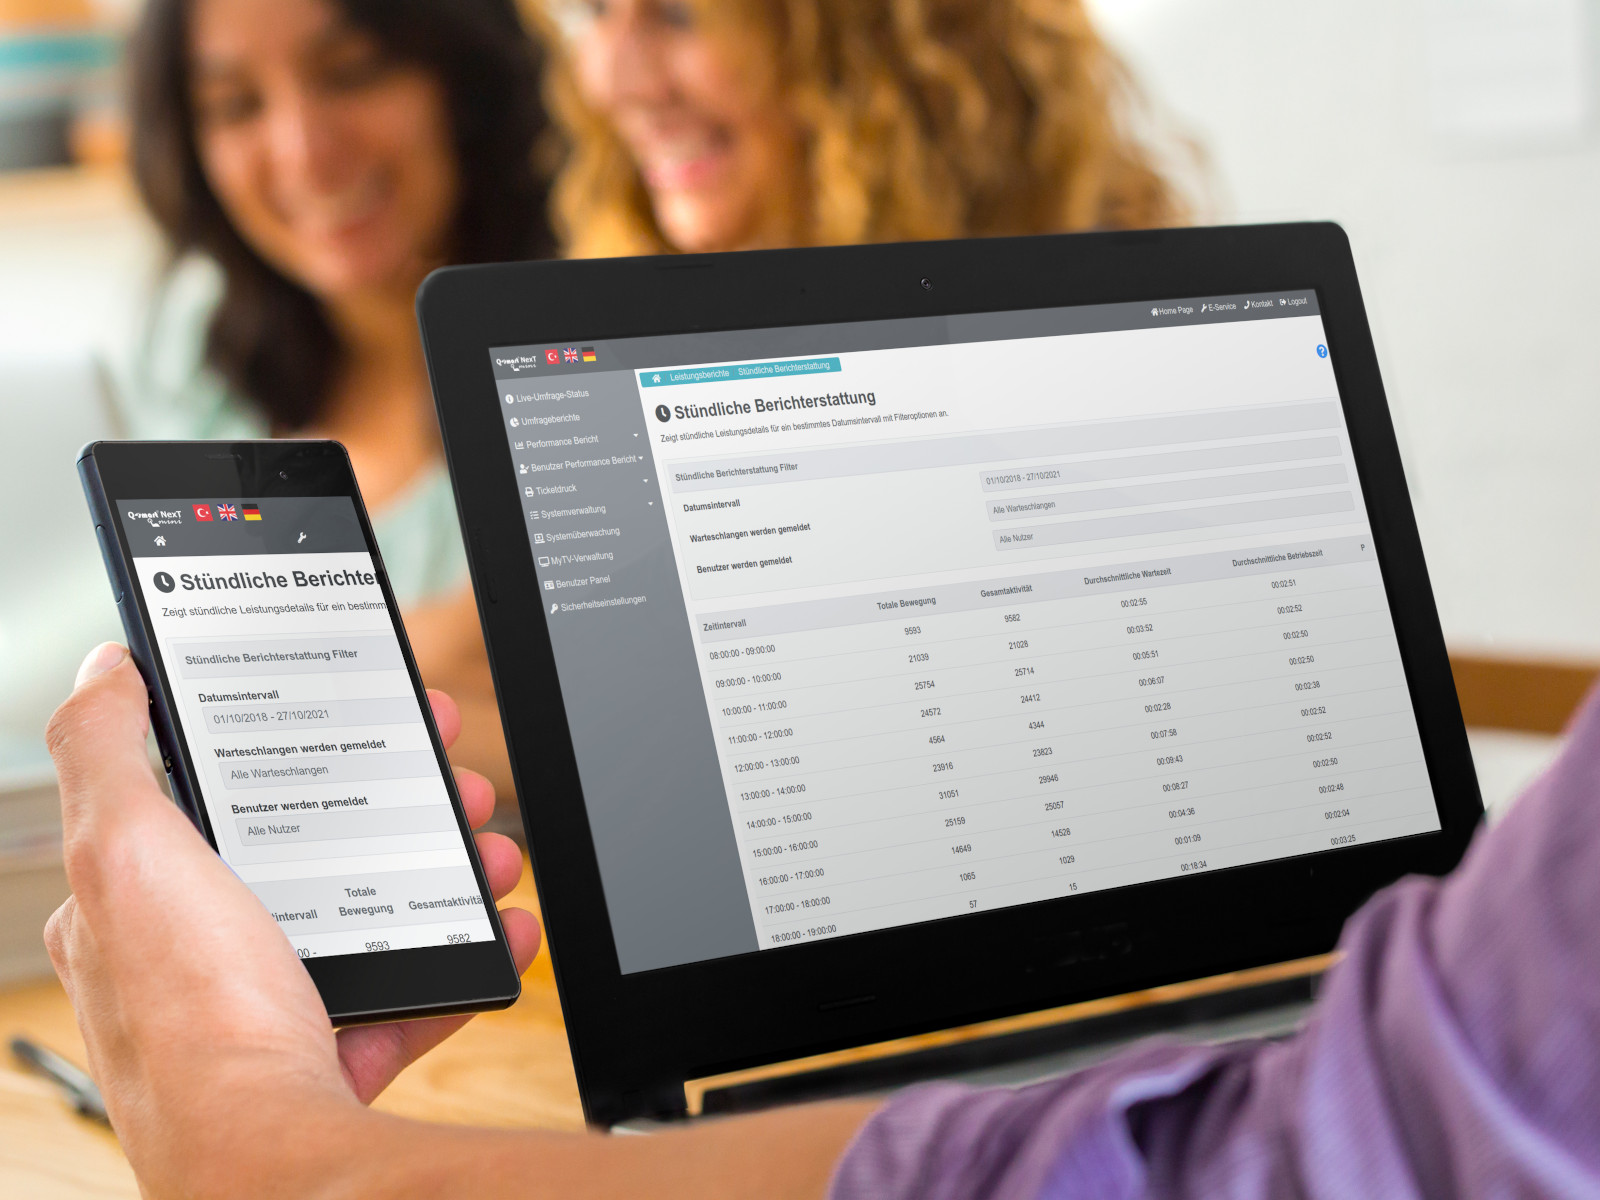

Responsive design
Peformance reports solution is designed for the purpose of operating properly on PC’s, tablets or smart phones in a portrait or landscape position.
By connecting to your system through standard web browsers wherever you want, you can receive current reports, track the status of your system online, change your ticket templates, add a queue to a branch you want and organize the task-list of the staff you want.
You don’t need to install any application to your smart phone or computer for all those actions. It operates compatible with your standard web browsers.

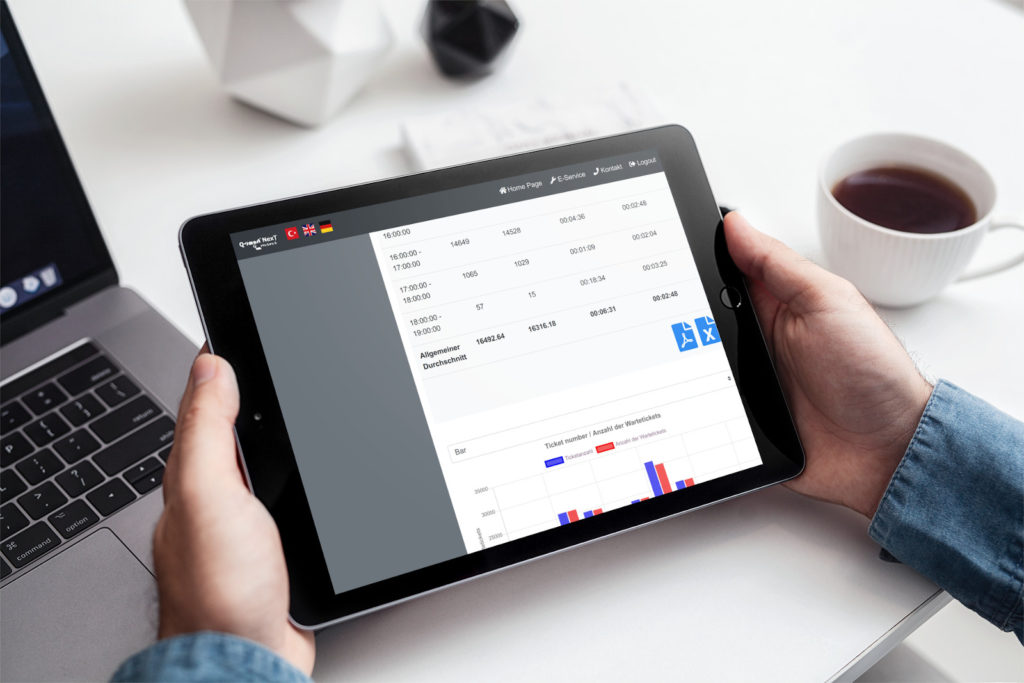
Wide data export alternatives
By means of developed dynamic table technology, you can immediately change the report data using sorting options and you can printout the data outputs to Excel, PDF and table.
Moreover, you can transfer the data externally using printed clipboard options.
Reporting web services can provide hourly, daily, monthly and yearly data, ticket details, user performance details, service performance details…etc to your business external sources.

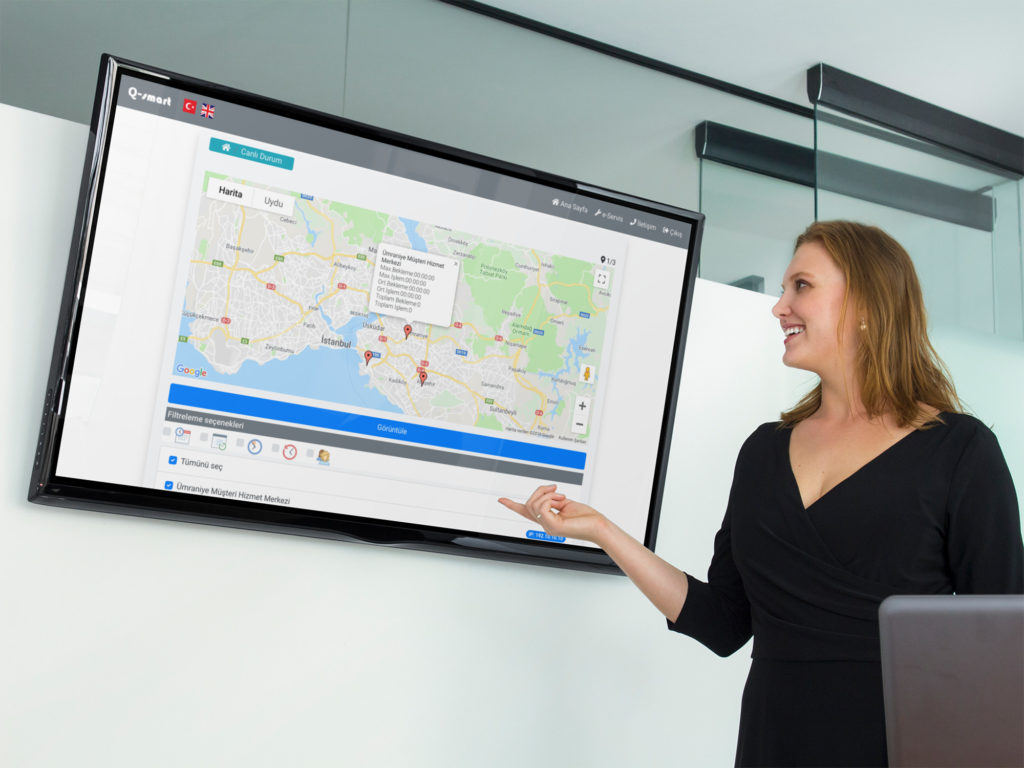
Google maps integration
The system which provides technical and performance information for your coordination center, presents received information simultaneously, by zooming on relevant locations on the map in the light of information coming from your branches.
The data such as scanning speed of the map, zoom degree, data and branches which will be monitored, update time can be customized as you please.

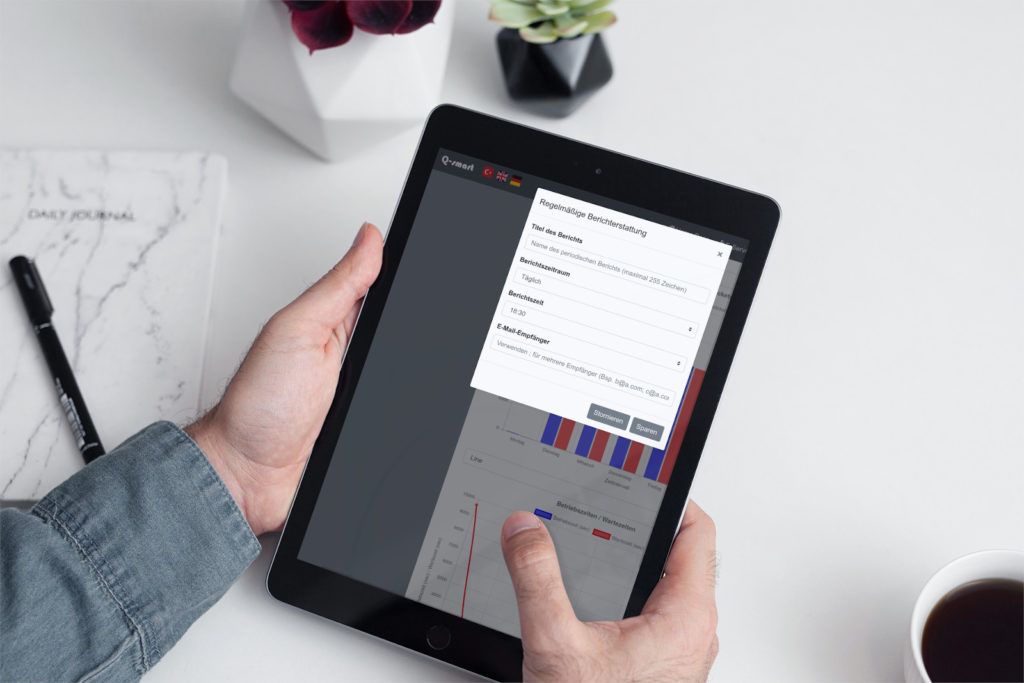
Periodically reporting
System sends you the performance reports of the services provided by your business periodically by e-mail.
You can select the services you want to be reported on, apply the filters you specify, and have the report automatically generated on a daily, weekly or monthly basis and sent to the people you specify by e-mail.
Once you have the performance report of your business, just hit the report periodically button. After making your periodic reporting settings, the system automatically sends the reports to the people you specify by e-mail.

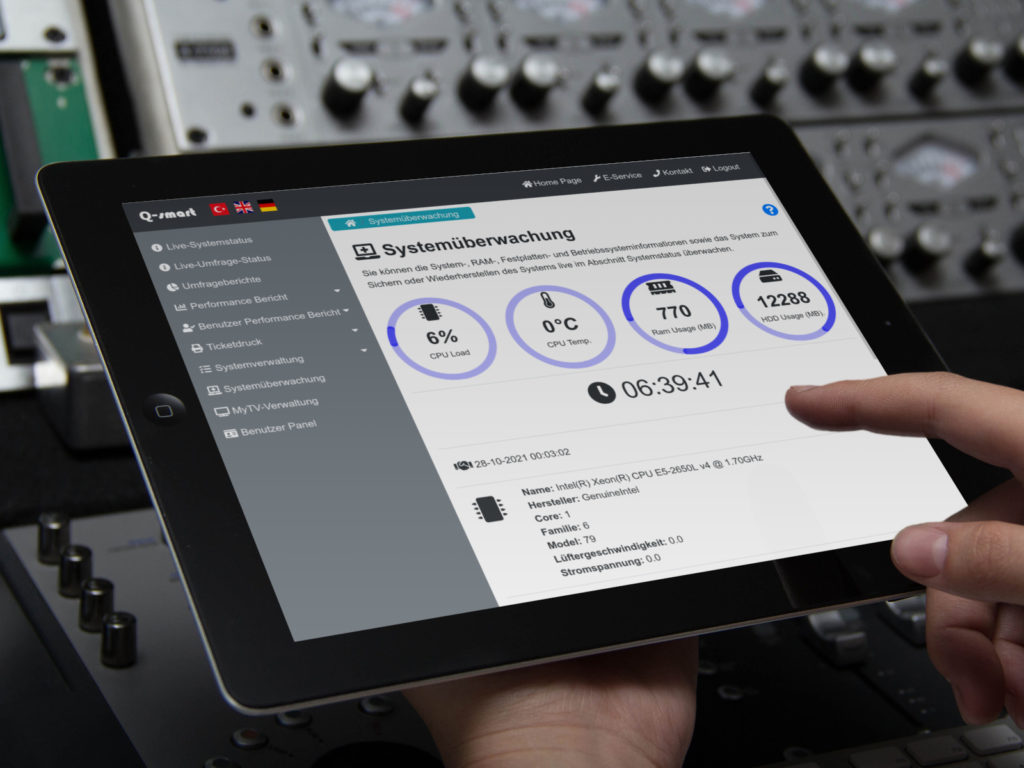
System monitoring
The system has integrated monitoring tools. From the web management interface of the system, you can monitor the current status of your hardware and the health of your system online.
You can get live status of operation time, CPU load, Ram, HDD and CPU temperature of the main unit, and your customer screens and room/staff screen communication status from anywhere you want.
If your system has the printer you can get status of the paper, paper jams, printer head temperature and printer cover online.